Top 4 Journals Classification Systems Every Researcher Should Know
If you’ve ever tried to figure out which journal is the best fit for your research or wondered how journals classification is carried out, you’ve probably come across terms like Quartiles (q1 q2 q3 q4 journal), h-index, Impact Factor (IF), and Source Normalised Impact per Paper (SNIP). These metrics might sound technical, but they are simply tools to measure how much attention a journal’s research gets. Here’s a straightforward explanation of what they mean and how they work
Quartiles in Journals Classification: Ranking by Performance
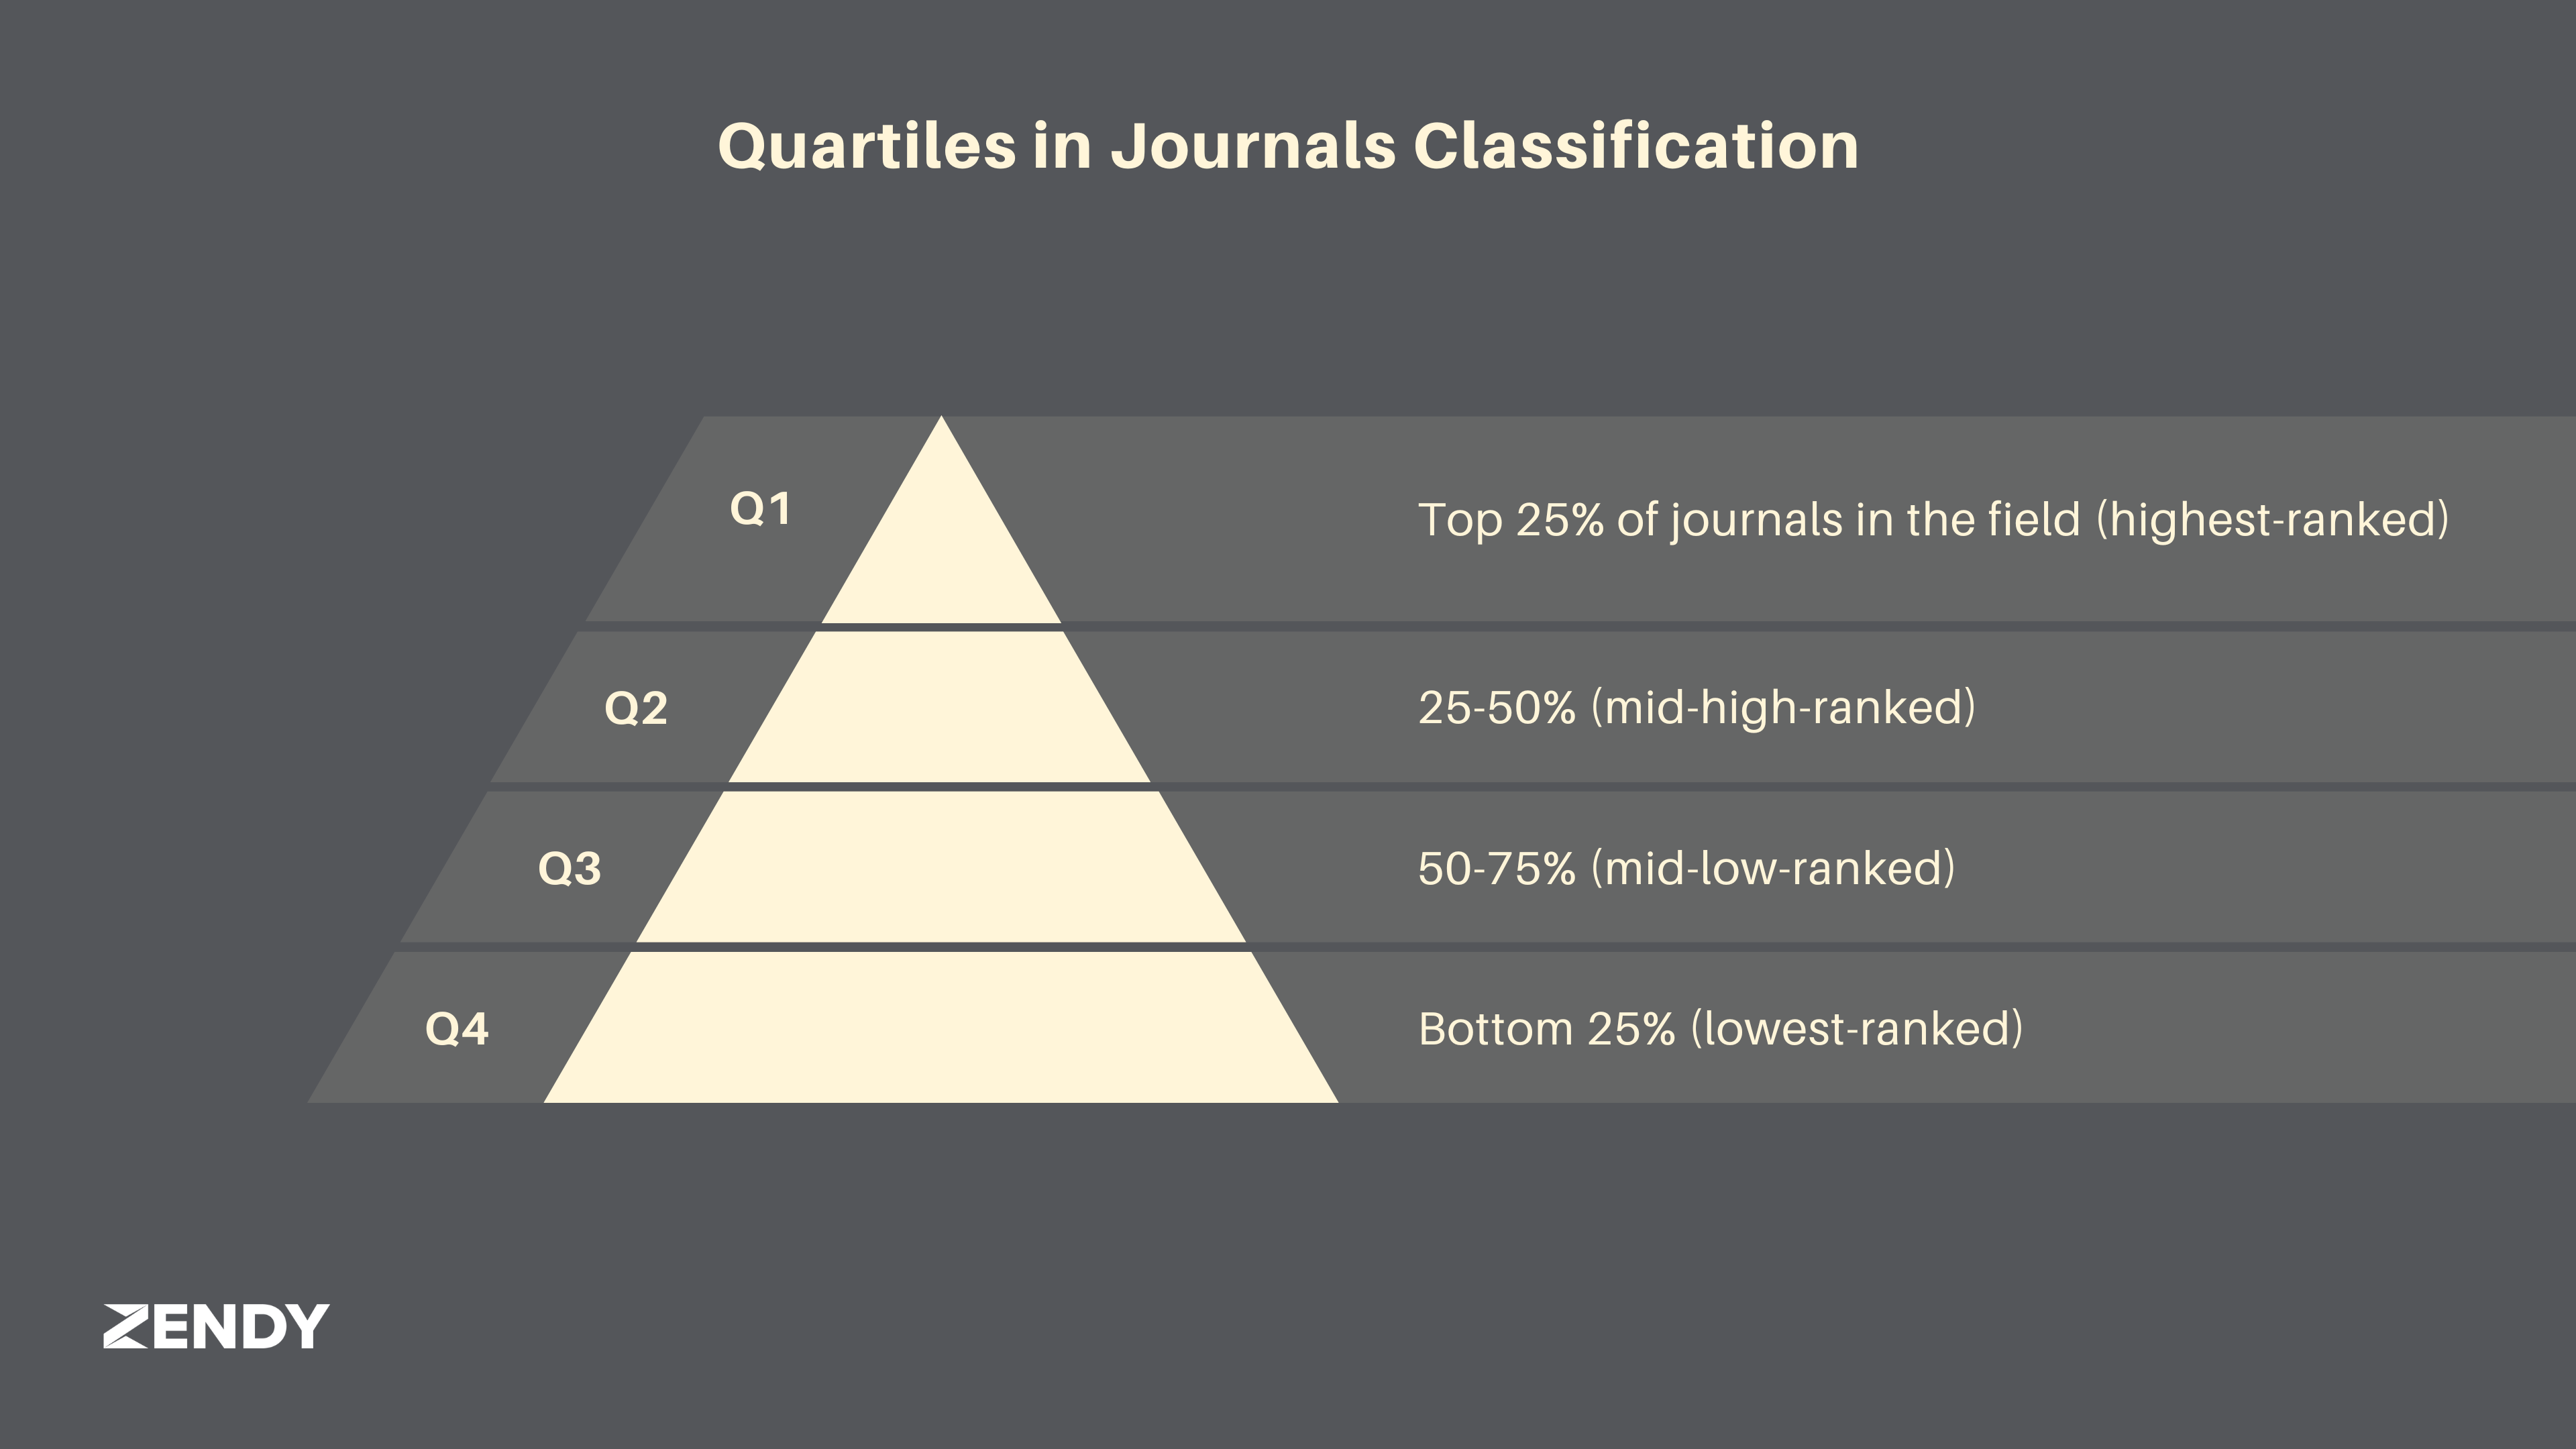
The system of dividing journals into four quartiles, Q1, Q2, Q3, and Q4, was created to make it easier to compare their quality and impact within a specific field. This idea became popular through Scopus and Journal Citation Reports (JCR) databases, which rank journals based on metrics like citations. The concept builds on the work of Eugene Garfield, who introduced the Impact Factor, offering a way to see how journals stand up against others. Quartiles break things down further: Q1 represents the top 25% of journals in a category, while Q4 includes those at the lower end. It's a straightforward way to help researchers determine which journals are most influential in their areas of study.
- Q1: Top 25% of journals in the field (highest-ranked).
- Q2: 25-50% (mid-high-ranked).
- Q3: 50-75% (mid-low-ranked).
- Q4: Bottom 25% (lowest-ranked).
However, not all Q3 or Q4 journals are necessarily a disadvantage. While they may not be as well-known, they are still important in scientific research. Some of the benefits include:
- Affordability: These journals are easier for researchers to access, especially for those on a tight budget.
- Focused Topics: They tend to cover more specific, niche areas of study, making them great for in-depth exploration of certain subjects.
- Great for New Researchers: Q3 and Q4 journals classification can be a good place for new researchers to publish their first paper and gain experience in the publishing world.
- Ideal for Basic Research: They’re a great option for research that focuses on the basics of science
Finally, publishing your article in a Q3 or Q4 journal doesn’t mean it lacks value or won’t make an impact. If your work presents new findings that address a real problem, it can still attract attention, even when published in a lower-ranked journal.
h-index: A Balance of Quantity and Quality
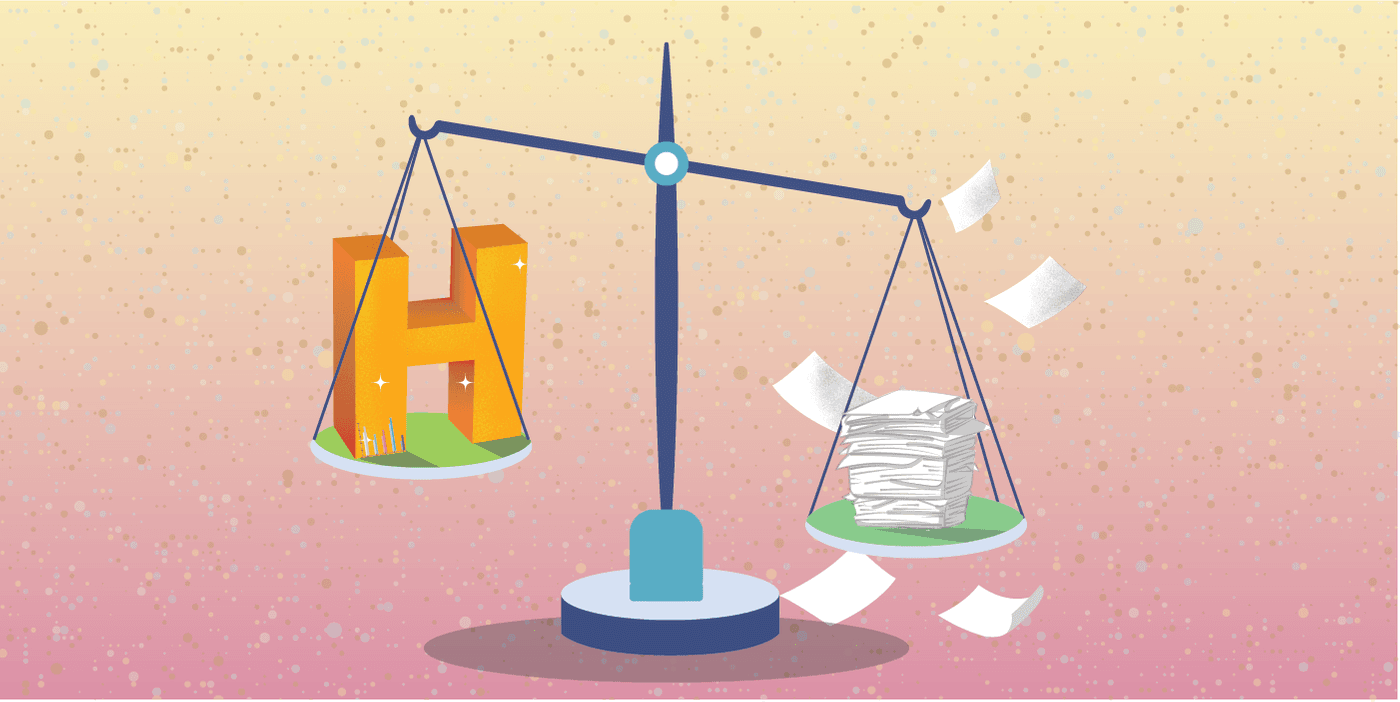
The h-index score is an important factor in journal classification. It looks at the number of articles a journal has published and how often those articles are cited. It balances quantity (how many articles a journal publishes) with quality (how many of its articles are referenced).
For example, if a journal has an h-index of 15, it means it has published 15 articles, each cited at least 15 times. It’s a simple way to measure a journal’s influence without focusing too much on just one super-cited article or a bunch of rarely cited ones.
How h-index works:
Let’s say a journal has published 4 articles, and the number of citations for each article looks like this:
- The 1st article has 10 citations – exceeds 1 citation.
- The 2nd article has 24 citations – exceeds 2 citations.
- The 3rd article has 5 citations – exceeds 3 citations.
- The 4th article falls short of 4 citations.
In this case, the journal has three articles that each have at least three citations. The fourth article doesn’t hit the mark, so the h-index stops at 3.
This metric can help researchers, professionals, and institutions decide if a journal publishes research that gets noticed and cited by the academic community. It’s not the full picture, but it’s a useful starting point for understanding the journal’s influence.
Impact Factor: Citation Average
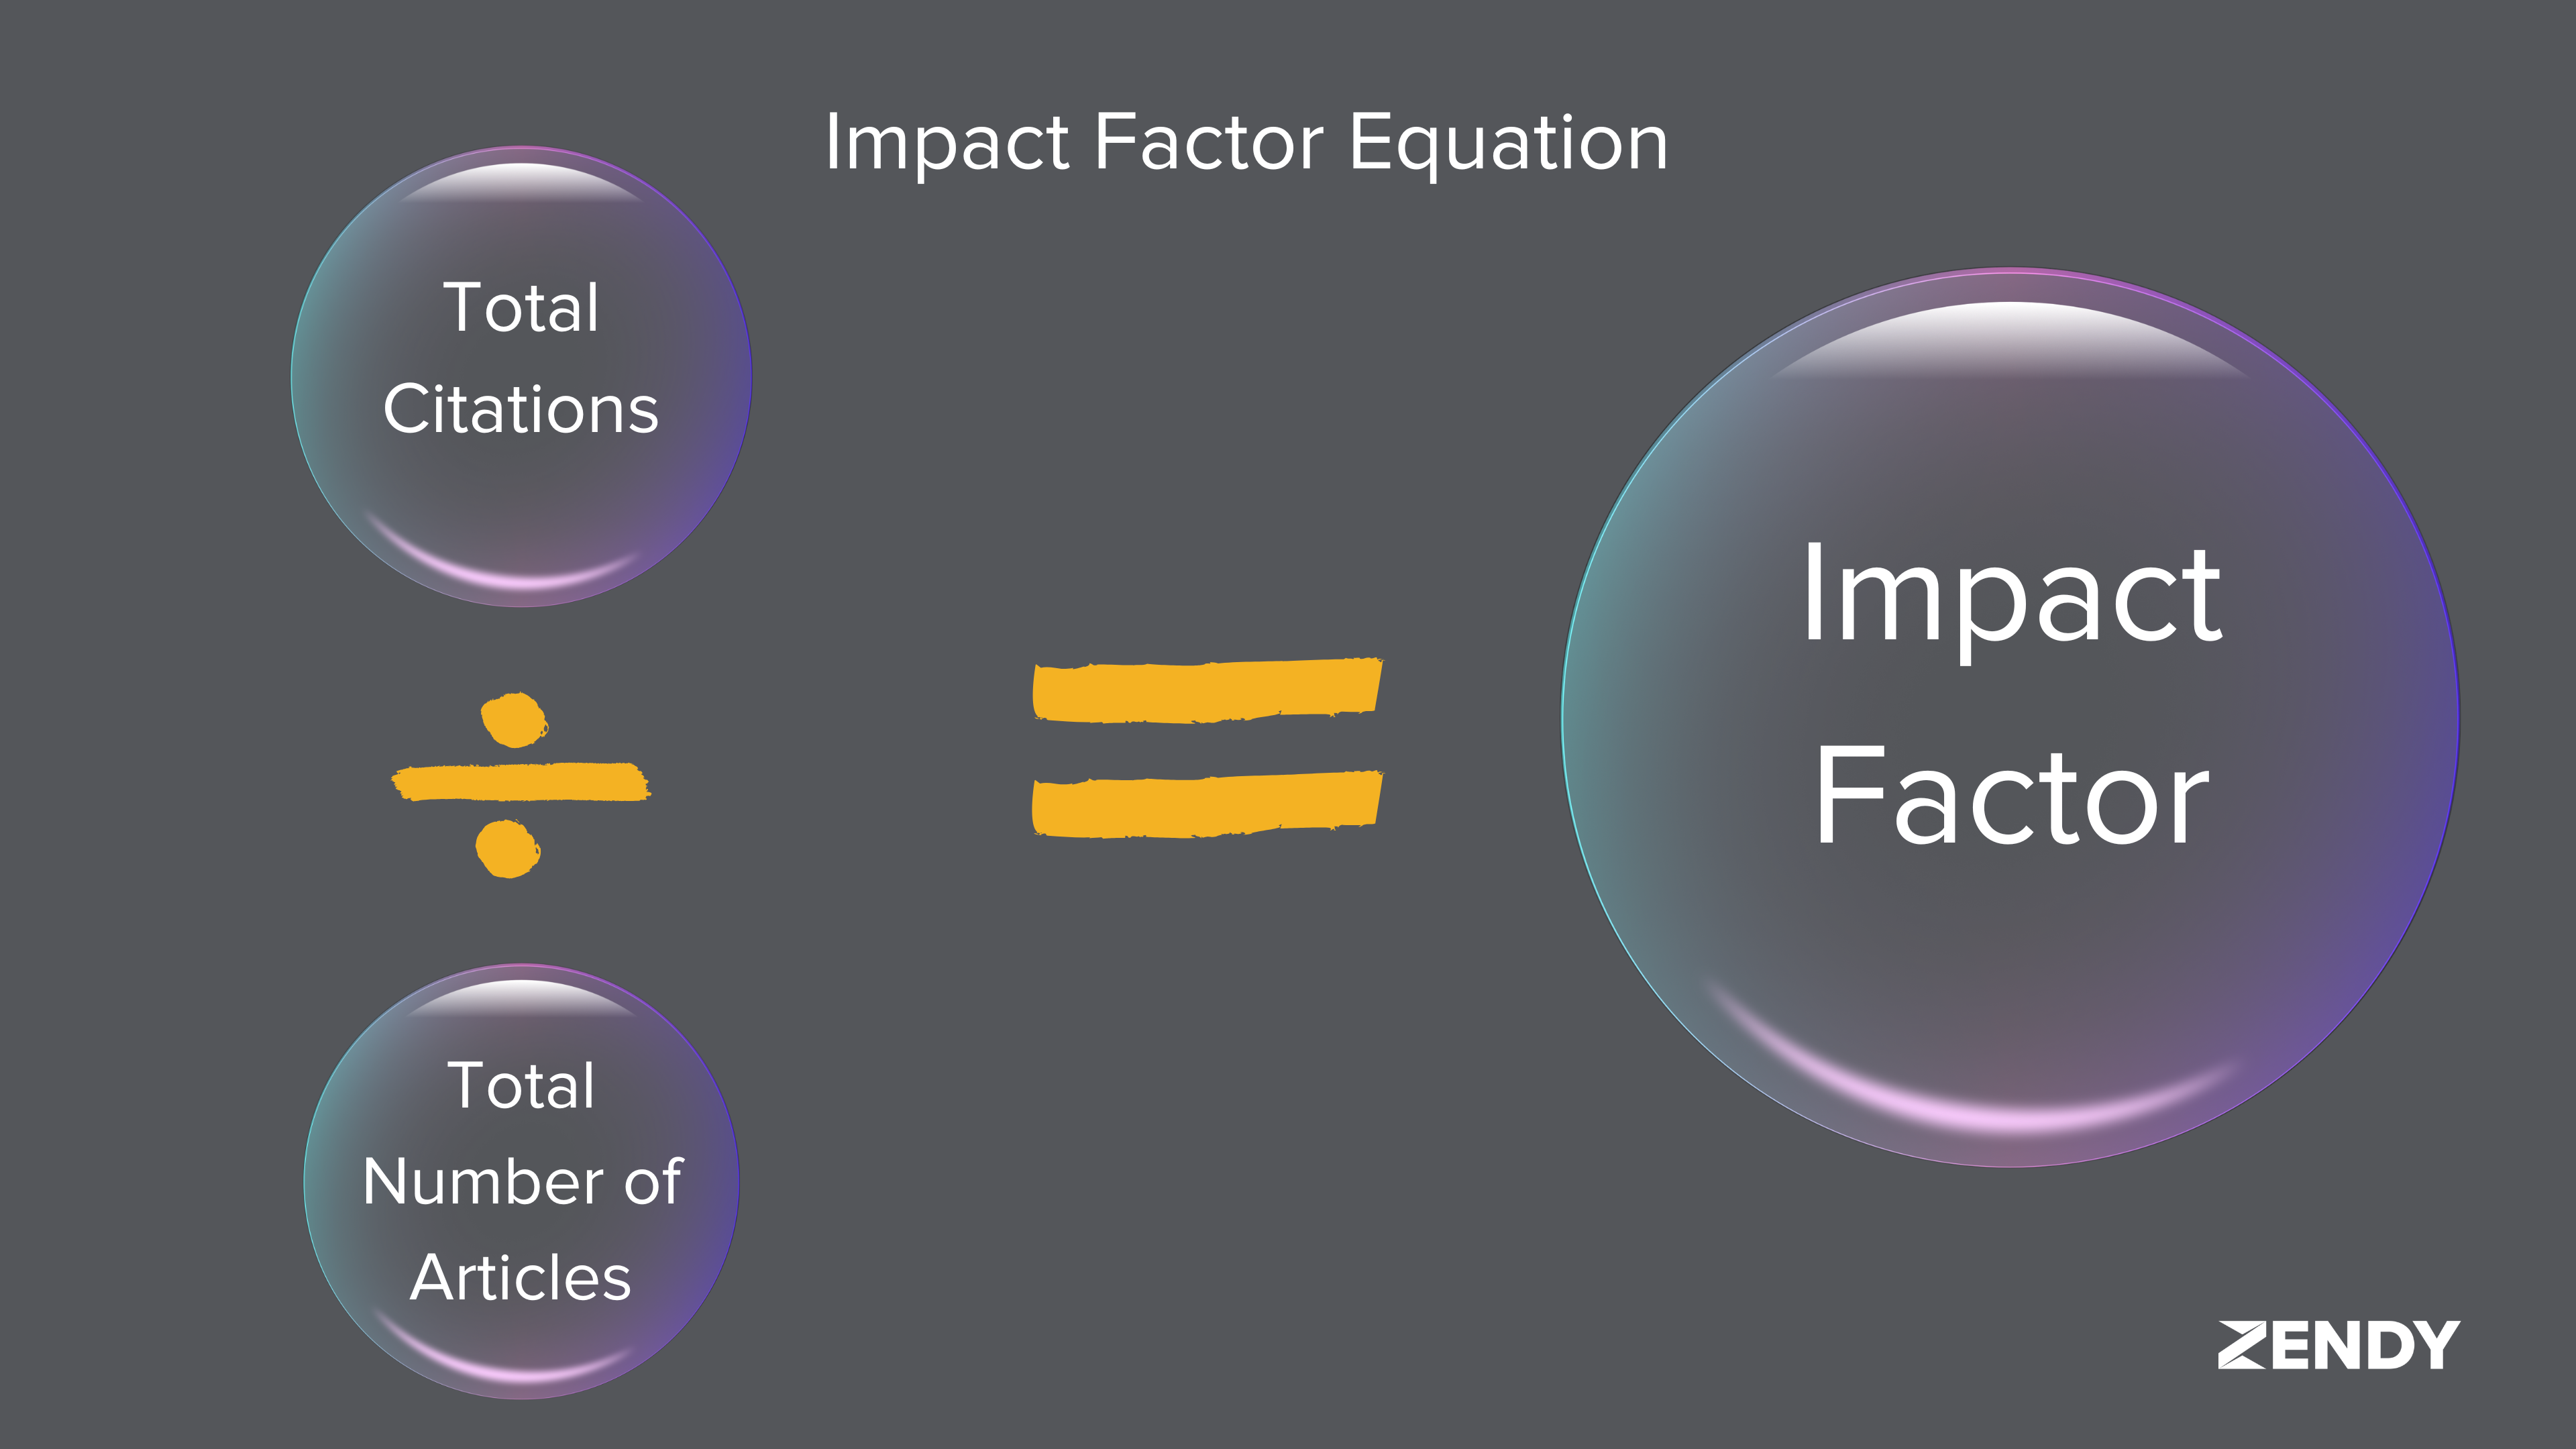
The Impact Factor (IF) is a number that shows how often a journal’s articles are cited on average over the past two years. It helps you understand how much attention the journal’s research gets from other scholars and it also helps with journals classification.
How it works?
To calculate the IF, look at how many times articles from a journal were cited in the past two years. Then, you divide that by the total number of articles the journal published in those two years. This gives you an average citation count per article.
Example:
Let’s say we want to figure out the IF for Journal A in 2023:
- In 2021 and 2022, Journal A published 50 articles.
- In 2023, those articles were cited 200 times in total.
- You take the total citations (200) and divide it by the total number of articles (50): 200 ÷ 50 = 4
So, Journal A has an Impact Factor of 4, meaning its articles were cited, on average, four times each. A higher Impact Factor often places journals higher in classification, but keep in mind that it’s not the full story. Some specialised journals may have lower Impact Factors even though they’re highly respected in their niche.
SNIP: Fair Comparisons Across Fields
SNIP (Source Normalised Impact per Paper) is a valuable metric in journals classification because it goes one step further. It measures contextual citation impact and takes into account the fact that different research fields have different citation habits. For instance, medical papers often get cited a lot, while mathematics papers don’t, even if they’re equally important in their fields.
SNIP adjusts the average citations a journal receives based on these differences, making it easier to compare journals across disciplines.
Example:
- Journal A publishes in a low-citation field like social sciences and averages 3 citations per article. Adjusted for its field, its SNIP might be 1.6.
- Journal B publishes in a high-citation field like biomedicine and has an average of 8 citations per article. After adjustment, its SNIP might be 1.2.
SNIP makes sure journals in fields with fewer citations still get the recognition they deserve.
What it tells you:
SNIP is especially useful for journal classification because it levels the playing field between disciplines. A higher SNIP score suggests that a journal’s articles are cited more often than expected for its field. It’s a helpful tool for comparing journals, but it’s just one of many ways to evaluate a journal’s influence or importance.
Below is a concise summary table of the four journal classification systems, followed by key considerations:
Journal ranking system comparison
| System | Purpose | Calculation | Key Insights |
|---|---|---|---|
| Quartiles (Q1-Q4) | Ranks journals by performance within a field (e.g., biology, engineering). | Journals divided into four equal groups based on citation metrics (e.g., Impact Factor): • Q1: Top 25% • Q2: 25-50% • Q3: 50-75% • Q4: Bottom 25%. | • Q1/Q2 = high prestige. • Q3/Q4 = affordable, niche-focused, beginner-friendly. • Lower quartiles ≠ low-value research. |
| h-index | Measures journal influence by balancing article productivity and citations. | A journal has index h if it published h articles each cited ≥ h times.Example: h-index=15 means 15 articles cited ≥15 times each. | • Avoids over-reliance on single highly cited papers. • Useful for gauging consistent impact. |
| Impact Factor (IF) | Indicates average citation attention per article. | IF = (Citations in year Y to articles from Y-1 and Y-2) ÷ (Articles published in Y-1 and Y-2). Example: 200 citations ÷ 50 articles = IF 4. | • Higher IF = higher ranking. • Field-dependent: STEM > humanities. • Less meaningful for niche fields. |
| SNIP | Compares journals fairly across fields by normalizing citation practices. | Adjusts raw citations per paper by field’s typical citation density. Example: 3 citations in social sciences (SNIP=1.6) vs. 8 in biomedicine (SNIP=1.2). | • Levels comparison between high/low-citation fields. • SNIP >1 = above-field-average impact. |
Key Considerations for All Systems
- No single metric tells the whole story – A journal may rank highly in one system but lower in another.
- Field-specific biases – Metrics like IF and SNIP adjust for disciplinary differences (e.g., mathematics vs. medicine).
- Beyond rankings – Lower-quartile/niche journals offer unique advantages (accessibility, specialization).
- Research goals matter – Choose a journal based on audience fit, not just classification.

![[webinar]: Strategically Implementing Zendy AI for the Modern Library](/_next/image?url=https://curated-unify.zendy.io/wp-content/uploads/2026/04/Screenshot-2026-06-18-at-9.32.39 AM.png&w=750&q=100)
[webinar]: Strategically Implementing Zendy AI for the Modern Library
As Artificial Intelligence moves from a "future tech" concept to a daily necessity in higher education, the role of the academic library is changing with it. The challenge lies in strategic implementation. How do we integrate these powerful capabilities to enhance discovery while maintaining academic integrity? Our upcoming free webinar, "Strategically Implement Zendy AI Capabilities in your Library for Enhanced Discovery," will answer exactly that. What This Webinar Will Cover The evolving role of AI in modern academic libraries How Zendy can function as a discovery layer for existing digital library systems Strategies to enhance content discoverability across diverse resources Streamlining research workflows for students and researchers Maximizing the value and usage of existing library collections through AI Speakers Kamran Kardan, CEO and Co-Founder, Zendy Kamran is the Founder and CEO of Knowledge E and the visionary behind Zendy. With over 20 years of experience in global publishing, he is dedicated to removing barriers to information. He founded Knowledge E in 2012 to support research and education in the MENA region, later launching Zendy as a mission-driven, AI-powered platform to provide affordable access to scholarly literature worldwide. Rodrigo Pinto, Chief Technology Officer, Zendy Rodrigo leads Zendy’s technical strategy and the development of its advanced AI discovery tools. With over 25 years of experience in software engineering and cloud infrastructure, he is the primary architect behind Zendy AI Discovery and the Zendy AI Assistant (ZAIA). Rodrigo focuses on ensuring the platform remains at the forefront of discovery technology while maintaining high standards of data integrity and user experience. Moderated by: Lisette van Kesssel, Head of Marketing, Zendy Lisette oversees marketing for both Knowledge E and Zendy, driving global brand visibility and user engagement. She brings extensive experience in digital strategy and brand management to the team. A strong advocate for social impact and Diversity, Equity, and Inclusion (DEI), Lisette focuses on connecting emerging research communities with the resources they need to thrive. Join Us Date: 21 April, Tuesday Time: 4 PM (GST) 2 PM (CEST) Register for the free webinar here .wp-block-image img { max-width: 85% !important; margin-left: auto !important; margin-right: auto !important; }

Research Integrity, Partnership, and Societal Impact
Research integrity extends beyond publication to include how scholarship is discovered, accessed, and used, and its societal impact depends on more than editorial practice alone. In practice, integrity and impact are shaped by a web of platforms and partnerships that determine how research actually travels beyond the press. University press scholarship is generally produced with a clear public purpose, speaking to issues such as education, public health, social policy, culture, and environmental change, and often with the explicit aim of informing practice, policy, and public debate. Whether that aim is realised increasingly depends on what happens to research once it leaves the publishing workflow. Discovery platforms, aggregators, library consortia, and technology providers all influence this journey. Choices about metadata, licensing terms, ranking criteria, or the use of AI-driven summarisation affect which research is surfaced, how it is presented, and who encounters it in the first place. These choices can look technical or commercial on the surface, but they have real intellectual and social consequences. They shape how scholarship is understood and whether it can be trusted beyond core academic audiences. For university presses, this changes where responsibility sits. Editorial quality remains critical, but it is no longer the only consideration. Presses also have a stake in how their content is discovered, contextualised, and applied in wider knowledge ecosystems. Long-form and specialist research is particularly exposed here. When material is compressed or broken apart for speed and scale, nuance can easily be lost, even when the intentions behind the system are positive. This is where partnerships start to matter in a very practical way. The conditions under which presses work with discovery services directly affect whether their scholarship remains identifiable, properly attributed, and anchored in its original context. For readers using research in teaching, healthcare, policy, or development settings, these signals are not decorative. They are essential to responsible use. Zendy offers one example of how these partnerships can function differently. As a discovery and access platform serving researchers, clinicians, and policymakers in emerging and underserved markets, Zendy is built around extending reach without undermining trust. University press content is surfaced with clear attribution, structured metadata, and rights-respecting access models that preserve the integrity of the scholarly record. Zendy works directly with publishers to agree how content is indexed, discovered, and, where appropriate, summarised. This gives presses visibility into and control over how their work appears in AI-supported discovery environments, while helping readers approach research with a clearer sense of scope, limitations, and authority. From a societal impact perspective, this matters. Zendy’s strongest usage is concentrated in regions where access to trusted scholarship has long been uneven, including parts of Africa, the Middle East, and Asia. In these contexts, university press research is not being read simply for academic interest. It is used in classrooms, clinical settings, policy development, and capacity-building efforts, areas closely connected to the Sustainable Development Goals. Governance really sits at the heart of this kind of model. Clear and shared expectations around metadata quality, content provenance, licensing boundaries, and the use of AI are what make the difference between systems that encourage genuine engagement and those that simply amplify visibility without depth. Metadata is not just a technical layer: it gives readers the cues they need to understand what they are reading, where it comes from, and how it should be interpreted. AI-driven discovery and new access models create real opportunities to broaden the reach of university press publishing and to connect trusted scholarship with communities that would otherwise struggle to access it. But reach on its own does not equate to impact. When context and attribution are lost, the value of the research is diminished. Societal impact depends on whether work is understood and used with care, not simply on how widely it circulates. For presses with a public-interest mission, active participation in partnerships like these is a way to carry their values into a more complex and fast-moving environment. As scholarship is increasingly routed through global, AI-powered discovery systems, questions of integrity, access, and societal relevance converge. Making progress on shared global challenges requires collaboration, shared responsibility, and deliberate choices about the infrastructures that connect research to the wider world. For university presses, this is not a departure from their mission, but a continuation of it, with partnerships playing an essential role. FAQ How do platforms and partnerships affect research integrity?Discovery platforms, aggregators, and technology partners influence which research is surfaced, how it’s presented, and who can access it. Choices around metadata, licensing, and AI summarization directly impact understanding and trust. Why are university press partnerships important?Partnerships allow presses to maintain attribution, context, and control over their content in discovery systems, ensuring that research remains trustworthy and properly interpreted. How does Zendy support presses and researchers?Zendy works with publishers to surface research with clear attribution, structured metadata, and rights-respecting access, preserving integrity while extending reach to underserved regions. For partnership inquiries, please contact: Sara Crowley Vigneau Partnership Relations Manager Email: s.crowleyvigneau@zendy.io .wp-block-image img { max-width: 65% !important; margin-left: auto !important; margin-right: auto !important; }

Beyond Publication. Access as a Research Integrity Issue
If research integrity now extends beyond publication to include how scholarship is discovered and used, then access is not a secondary concern. It is foundational. In practice, this broader understanding of integrity quickly runs into a hard constraint: access. A significant percentage of academic publishing is still behind paywalls, and traditional library sales models fail to serve institutions with limited budgetsor uneven digital infrastructure. Even where university libraries exist, access is often delayed or restricted to narrow segments of the scholarly record. The consequences are structural rather than incidental. When researchers and practitioners cannot access the peer-reviewed scholarship they need, it drops out of local research agendas, teaching materials as well as policy conversations. Decisions are then shaped by whatever information is most easily available, not necessarily by what is most rigorous or relevant. Over time, this weakens citation pathways, limits regional participation in scholarly debate, and reinforces global inequity in how knowledge is visible, trusted, and amplified. The ongoing success of shadow libraries highlights this misalignment: Sci-Hub reportedly served over 14 million monthly users in 2025, indicating sustained and widespread demand for academic research that existing access models continue to leave unmet. This is less about individual behaviour than about a system that consistently fails to deliver essential knowledge where it is needed most. The picture looks different when access barriers are reduced: usage data from open and reduced-barrier initiatives consistently show strong engagement across Asia and Africa, particularly in fields linked to health, education, social policy, and development. These patterns highlight how emerging economies rely on high-quality publishing in contexts where it directly impacts professional practice and public decision-making. From a research integrity perspective, this is important. When authoritative sources are inaccessible, alternative materials step in to fill the gap. The risk is not only exclusion, but distortion. Inconsistent, outdated, or unverified sources become more influential precisely because they are easier to obtain. Misinformation takes hold most easily where trusted knowledge is hardest to reach. Addressing access is about more than widening readership or improving visibility, it is about ensuring that high-quality scholarship can continue to shape understanding and decisions in the contexts it seeks to serve. For university presses committed to the public good, this challenge sits across discovery systems, licensing structures, technology platforms, and the partnerships that increasingly determine how research is distributed, interpreted, and reused. If research integrity now extends across the full lifecycle of scholarship, then sustaining it requires collective responsibility and shared frameworks. How presses engage with partners, infrastructures, and governance mechanisms becomes central to protecting both trust and impact. FAQ: What challenges exist in current access models?Many academic works remain behind paywalls, libraries face budget and infrastructure constraints, and access delays or restrictions can prevent researchers from using peer-reviewed scholarship effectively. What happens when research is inaccessible?When trusted sources are hard to reach, alternative, inconsistent, or outdated materials often fill the gap, increasing the risk of misinformation and weakening citation pathways. How does Zendy help address access challenges?Zendy provides affordable and streamlined access to high-quality research, helping scholars, practitioners, and institutions discover and use knowledge without traditional barriers. For partnership inquiries, please contact:Sara Crowley VigneauPartnership Relations ManagerEmail:s.crowleyvigneau@zendy.io .wp-block-image img { max-width: 65% !important; margin-left: auto !important; margin-right: auto !important; }
Address
John Eccles HouseRobert Robinson Avenue,
Oxford Science Park, Oxford
OX4 4GP, United Kingdom