Qualitative Research Data Analysis: How Researchers Study Text, Images, and Audio
When researchers start collecting qualitative data, they work with non-number-based information such as interview scripts, images, or audio recordings. Analysing this kind of data might seem tough, however, qualitative data analysis gives us organised ways to understand detailed descriptive info. Let's look at how researchers address analytics in academic research for texts, images, and audio, while also talking about why research data analysis matters overall.
What is Qualitative Data Analysis?
Qualitative data analysis examines and interprets non-numerical data to understand underlying themes, patterns, or stories. Unlike quantitative analysis, which focuses on numbers and statistical relationships, qualitative analysis emphasises meaning, context, and subjective interpretation. This type of research data analysis is often used in fields like sociology, anthropology, psychology, and education.
Steps in Qualitative Research Data Analysis
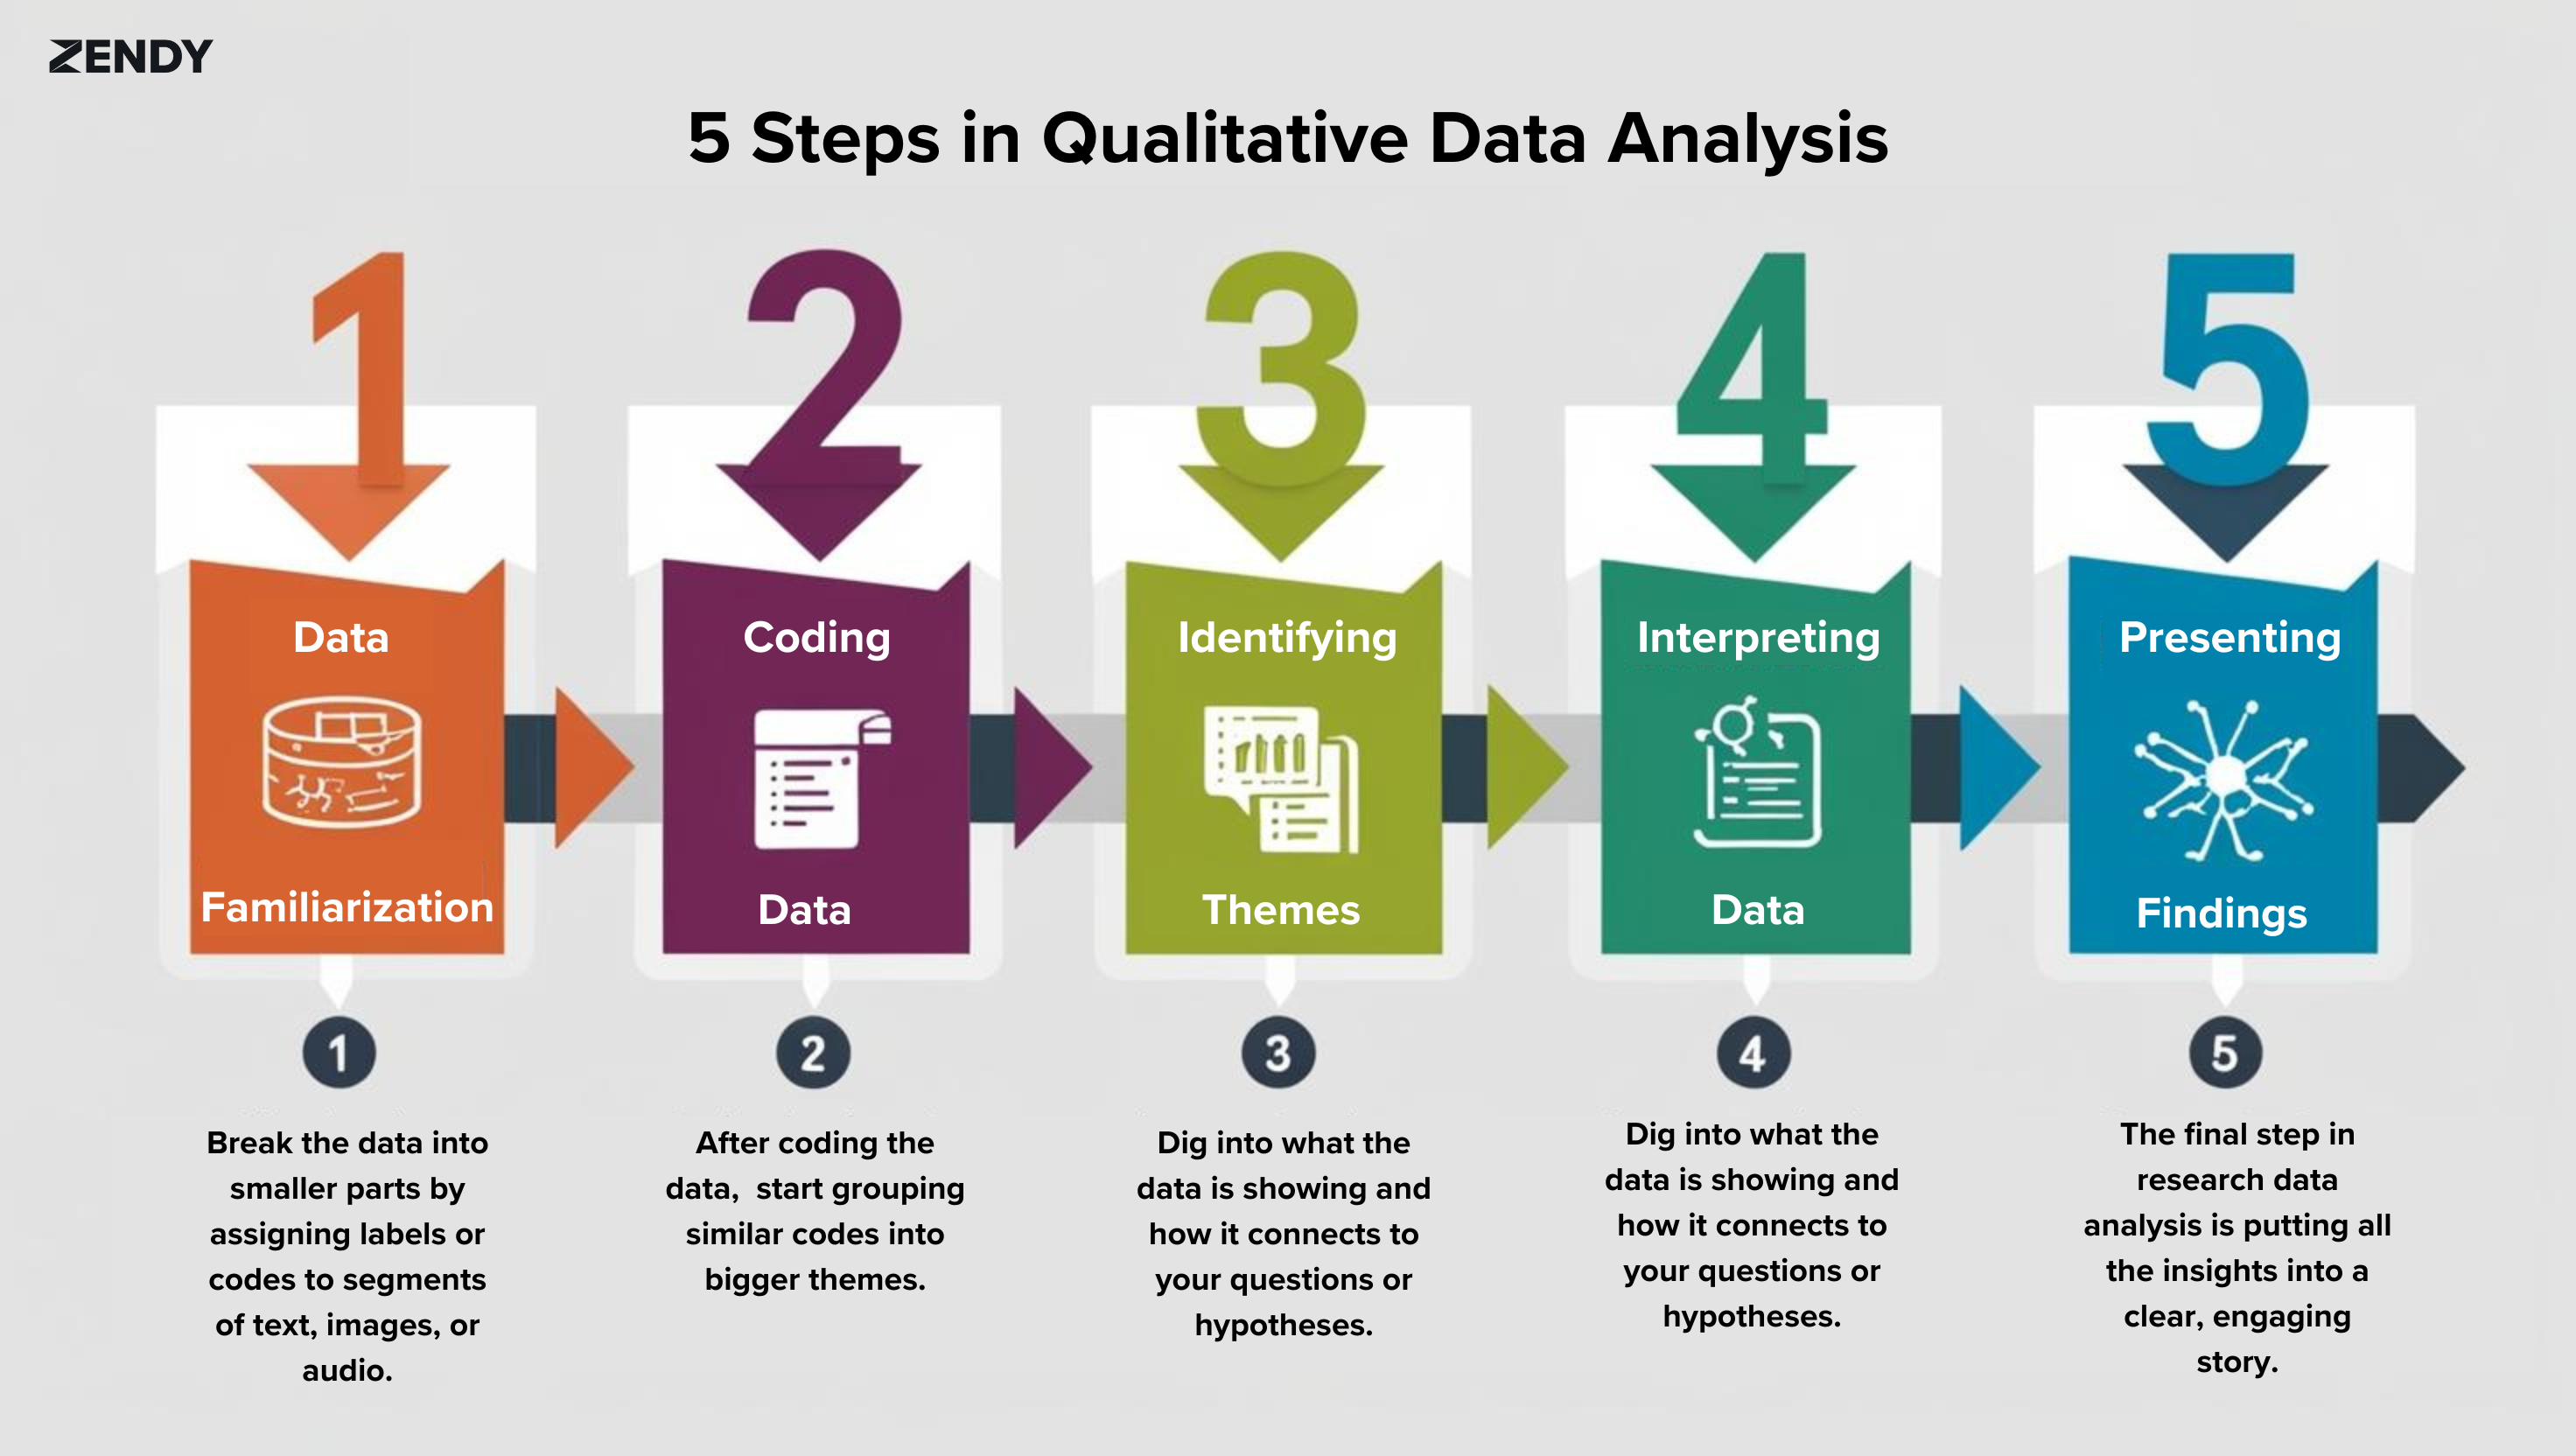
1. Data Familiarisation
Before jumping into research data analysis, researchers take time to really get familiar with the data. They might read transcripts, examine images, or listen to audio recordings several times. The goal is to fully understand the content and its context.
For example, a researcher looking at workplace communication might listen to recordings of team meetings to get a sense of the tone, how the conversation flows, and the main topics being discussed.
2. Coding the Data
Coding is a fundamental step in research data analysis. Researchers break the data into smaller parts by assigning labels or codes to segments of text, images, or audio. These codes represent themes, ideas, or categories that emerge from the data.
3. Identifying Themes
After coding the data, researchers start grouping similar codes into bigger themes. These themes are the main ideas or patterns that help answer the research question.
4. Interpreting the Data
Interpretation in research data analysis is about making sense of the themes in light of the research goals. Researchers dig into what the data is showing and how it connects to their questions or hypotheses.
5. Presenting Findings
The final step in research data analysis is putting all the insights into a clear, engaging story. This often involves using quotes from participants, highlighted images, or excerpts from audio transcripts to back up the findings.
Tools for Qualitative Data Analysis
While many researchers still analyze data manually, software tools can make the process a lot easier. Softwares like NVivo, ATLAS.ti, and MAXQDA help with coding, organising, and visualising the data. These tools are especially helpful in research data analysis when working with large datasets.
Applications of Qualitative Data Analysis
1. Text Analysis
Textual data includes interview transcripts, written surveys, and documents. Researchers examine word choice, sentence structure, and overall content to uncover insights.
2. Image Analysis
Analysing images in research data analysis involves looking at visual elements like colour, composition, and symbolism. This is often used in media studies, art history, and cultural research.
3. Audio Analysis
Audio data analysis in research, such as recorded interviews or podcasts, requires careful listening to capture nuances like tone, emphasis, and pauses.
The Importance of Data Analysis in Research
Qualitative data analysis is a vital part of research, it helps to uncover the stories and meanings behind the numbers. It gives context and depth to numerical data. By working with non-numerical data researchers can:
- Understand how people think and behave in different situations
- Explore cultural and social trends to see how they shape communities.
- Build theories based on real-life experiences and observations
Qualitative Research Best Practices
1. Be Clear About Your Purpose
Start with a straightforward question or goal. Why are you conducting this research? Knowing what you're looking for helps you stay focused and avoid getting lost in the details when conducting research data analysis.
2. Choose the Right People
Who can give you the best insights? Look for a mix of people with different experiences or perspectives. That makes it more valuable.
3. Build a Comfortable Environment
Imagine yourself as one of the participants. Would you be at ease expressing your opinions in this setting? People are more open in an informal, welcoming environment.
4. Keep an Open Mind
The unexpected may lead to the most insightful discoveries. Be adaptable and curious; go with the flow of the discussion.
5. Pay Attention to the Details
Make thorough notes or, with consent, record the conversation. A person's tone, pauses, and body language can all give away a lot about their intentions.
6. Treat People with Care
Be mindful of participants' boundaries, privacy, and time. Make sure they understand how their contributions will be used and that their contributions are valued.
7. Organise Your Findings
Sort your data into themes or patterns once you have it. Look for frequent arguments people give when answering your question.
8. Share What You Learn
Use actual quotes or cases as you write up your findings so that readers may see what others are saying in their own words.
9. Keep Learning
Each project is an opportunity to develop your abilities. To improve even more over time, take note of what went well and what didn't.
In conclusion
Research data analysis in qualitative studies turns raw data into insights. Whether it’s text, images or audio this process helps researchers explore the personal and cultural aspects of their work, to gain a deeper understanding of the experiences and views behind the data. It combines structure with interpretation to make rich descriptive data meaningful.

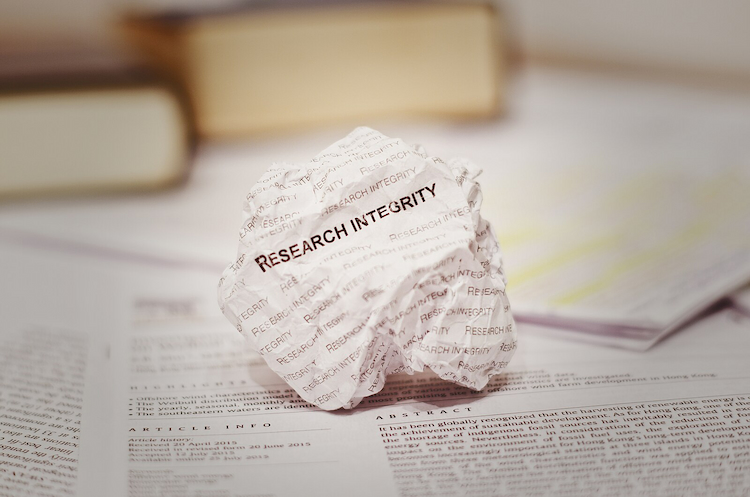
Research Integrity, Partnership, and Societal Impact
Research integrity extends beyond publication to include how scholarship is discovered, accessed, and used, and its societal impact depends on more than editorial practice alone. In practice, integrity and impact are shaped by a web of platforms and partnerships that determine how research actually travels beyond the press. University press scholarship is generally produced with a clear public purpose, speaking to issues such as education, public health, social policy, culture, and environmental change, and often with the explicit aim of informing practice, policy, and public debate. Whether that aim is realised increasingly depends on what happens to research once it leaves the publishing workflow. Discovery platforms, aggregators, library consortia, and technology providers all influence this journey. Choices about metadata, licensing terms, ranking criteria, or the use of AI-driven summarisation affect which research is surfaced, how it is presented, and who encounters it in the first place. These choices can look technical or commercial on the surface, but they have real intellectual and social consequences. They shape how scholarship is understood and whether it can be trusted beyond core academic audiences. For university presses, this changes where responsibility sits. Editorial quality remains critical, but it is no longer the only consideration. Presses also have a stake in how their content is discovered, contextualised, and applied in wider knowledge ecosystems. Long-form and specialist research is particularly exposed here. When material is compressed or broken apart for speed and scale, nuance can easily be lost, even when the intentions behind the system are positive. This is where partnerships start to matter in a very practical way. The conditions under which presses work with discovery services directly affect whether their scholarship remains identifiable, properly attributed, and anchored in its original context. For readers using research in teaching, healthcare, policy, or development settings, these signals are not decorative. They are essential to responsible use. Zendy offers one example of how these partnerships can function differently. As a discovery and access platform serving researchers, clinicians, and policymakers in emerging and underserved markets, Zendy is built around extending reach without undermining trust. University press content is surfaced with clear attribution, structured metadata, and rights-respecting access models that preserve the integrity of the scholarly record. Zendy works directly with publishers to agree how content is indexed, discovered, and, where appropriate, summarised. This gives presses visibility into and control over how their work appears in AI-supported discovery environments, while helping readers approach research with a clearer sense of scope, limitations, and authority. From a societal impact perspective, this matters. Zendy’s strongest usage is concentrated in regions where access to trusted scholarship has long been uneven, including parts of Africa, the Middle East, and Asia. In these contexts, university press research is not being read simply for academic interest. It is used in classrooms, clinical settings, policy development, and capacity-building efforts, areas closely connected to the Sustainable Development Goals. Governance really sits at the heart of this kind of model. Clear and shared expectations around metadata quality, content provenance, licensing boundaries, and the use of AI are what make the difference between systems that encourage genuine engagement and those that simply amplify visibility without depth. Metadata is not just a technical layer: it gives readers the cues they need to understand what they are reading, where it comes from, and how it should be interpreted. AI-driven discovery and new access models create real opportunities to broaden the reach of university press publishing and to connect trusted scholarship with communities that would otherwise struggle to access it. But reach on its own does not equate to impact. When context and attribution are lost, the value of the research is diminished. Societal impact depends on whether work is understood and used with care, not simply on how widely it circulates. For presses with a public-interest mission, active participation in partnerships like these is a way to carry their values into a more complex and fast-moving environment. As scholarship is increasingly routed through global, AI-powered discovery systems, questions of integrity, access, and societal relevance converge. Making progress on shared global challenges requires collaboration, shared responsibility, and deliberate choices about the infrastructures that connect research to the wider world. For university presses, this is not a departure from their mission, but a continuation of it, with partnerships playing an essential role. FAQ How do platforms and partnerships affect research integrity?Discovery platforms, aggregators, and technology partners influence which research is surfaced, how it’s presented, and who can access it. Choices around metadata, licensing, and AI summarization directly impact understanding and trust. Why are university press partnerships important?Partnerships allow presses to maintain attribution, context, and control over their content in discovery systems, ensuring that research remains trustworthy and properly interpreted. How does Zendy support presses and researchers?Zendy works with publishers to surface research with clear attribution, structured metadata, and rights-respecting access, preserving integrity while extending reach to underserved regions. For partnership inquiries, please contact: Sara Crowley Vigneau Partnership Relations Manager Email: s.crowleyvigneau@zendy.io .wp-block-image img { max-width: 65% !important; margin-left: auto !important; margin-right: auto !important; }

Beyond Publication. Access as a Research Integrity Issue
If research integrity now extends beyond publication to include how scholarship is discovered and used, then access is not a secondary concern. It is foundational. In practice, this broader understanding of integrity quickly runs into a hard constraint: access. A significant percentage of academic publishing is still behind paywalls, and traditional library sales models fail to serve institutions with limited budgetsor uneven digital infrastructure. Even where university libraries exist, access is often delayed or restricted to narrow segments of the scholarly record. The consequences are structural rather than incidental. When researchers and practitioners cannot access the peer-reviewed scholarship they need, it drops out of local research agendas, teaching materials as well as policy conversations. Decisions are then shaped by whatever information is most easily available, not necessarily by what is most rigorous or relevant. Over time, this weakens citation pathways, limits regional participation in scholarly debate, and reinforces global inequity in how knowledge is visible, trusted, and amplified. The ongoing success of shadow libraries highlights this misalignment: Sci-Hub reportedly served over 14 million monthly users in 2025, indicating sustained and widespread demand for academic research that existing access models continue to leave unmet. This is less about individual behaviour than about a system that consistently fails to deliver essential knowledge where it is needed most. The picture looks different when access barriers are reduced: usage data from open and reduced-barrier initiatives consistently show strong engagement across Asia and Africa, particularly in fields linked to health, education, social policy, and development. These patterns highlight how emerging economies rely on high-quality publishing in contexts where it directly impacts professional practice and public decision-making. From a research integrity perspective, this is important. When authoritative sources are inaccessible, alternative materials step in to fill the gap. The risk is not only exclusion, but distortion. Inconsistent, outdated, or unverified sources become more influential precisely because they are easier to obtain. Misinformation takes hold most easily where trusted knowledge is hardest to reach. Addressing access is about more than widening readership or improving visibility, it is about ensuring that high-quality scholarship can continue to shape understanding and decisions in the contexts it seeks to serve. For university presses committed to the public good, this challenge sits across discovery systems, licensing structures, technology platforms, and the partnerships that increasingly determine how research is distributed, interpreted, and reused. If research integrity now extends across the full lifecycle of scholarship, then sustaining it requires collective responsibility and shared frameworks. How presses engage with partners, infrastructures, and governance mechanisms becomes central to protecting both trust and impact. FAQ: What challenges exist in current access models?Many academic works remain behind paywalls, libraries face budget and infrastructure constraints, and access delays or restrictions can prevent researchers from using peer-reviewed scholarship effectively. What happens when research is inaccessible?When trusted sources are hard to reach, alternative, inconsistent, or outdated materials often fill the gap, increasing the risk of misinformation and weakening citation pathways. How does Zendy help address access challenges?Zendy provides affordable and streamlined access to high-quality research, helping scholars, practitioners, and institutions discover and use knowledge without traditional barriers. For partnership inquiries, please contact:Sara Crowley VigneauPartnership Relations ManagerEmail:s.crowleyvigneau@zendy.io .wp-block-image img { max-width: 65% !important; margin-left: auto !important; margin-right: auto !important; }
Beyond Peer Review. Research Integrity in University Press Publishing
University presses play a distinctive role in advancing research integrity and societal impact. Their publishing programmes are closely aligned with public-interest research in the humanities, social sciences, global health, education, and environmental studies, disciplines that directly inform policy and progress toward the UN Sustainable Development Goals. This work typically prioritises depth, context, and long-term understanding, often drawing on regional expertise and interdisciplinary approaches rather than metrics-driven outputs. Research integrity is traditionally discussed in terms of editorial rigour, peer review, and ethical standards in the production of scholarship. These remain essential. But in an era shaped by digital platforms and AI-led discovery, they are no longer sufficient on their own. Integrity now also depends on what happens after publication: how research is surfaced, interpreted, reduced, and reused. For university presses, this shift is particularly significant. Long-form scholarship, a core strength of press programmes, is increasingly encountered through abstracts, summaries, extracts, and automated recommendations rather than sustained reading. As AI tools mediate more first encounters with research, meaning can be subtly altered through selection, compression, or loss of context. These processes are rarely neutral. They encode assumptions about relevance, authority, and value. This raises new integrity questions. Who decides which parts of a work are highlighted or omitted? How are disciplinary nuance and authorial intent preserved when scholarship is summarised? What signals remain to help readers understand scope, limitations, or evidentiary weight? This isn’t to say that AI-driven discovery is inherently harmful, but it does require careful oversight. If university press scholarship is to continue informing research, policy, and public debate in meaningful ways, it needs to remain identifiable, properly attributed, and grounded in its original framing as it moves through increasingly automated discovery systems. In this context, research integrity extends beyond how scholarship is produced to include how it is processed, surfaced and understood. For presses with a public-interest mission, research integrity now extends across the full journey of a work, from how it is published to how it is discovered, interpreted and used. FAQ Can Zendy help with AI-mediated research discovery?Yes. Zendy’s tools help surface, summarise, and interpret research accurately, preserving context and authorial intent even when AI recommendations are used. Does AI discovery harm research, or can it be beneficial?AI discovery isn’t inherently harmful—it can increase visibility and accessibility. However, responsible use is essential to prevent misinterpretation or loss of nuance, ensuring research continues to inform policy and public debate accurately. How does Zendy make research more accessible?Researchers can explore work from multiple disciplines, including humanities, social sciences, global health, and environmental studies, all in one platform with easy search and AI-powered insights. For partnership inquiries, please contact:Sara Crowley Vigneau Partnership Relations Manager Email: s.crowleyvigneau@zendy.io .wp-block-image img { max-width: 65% !important; margin-left: auto !important; margin-right: auto !important; }
Address
John Eccles HouseRobert Robinson Avenue,
Oxford Science Park, Oxford
OX4 4GP, United Kingdom